
 FULL-PROFILES
Select FILE then FIND-A-HORSE (or click the FIND-A-HORSE button) to profile any horse at any time.
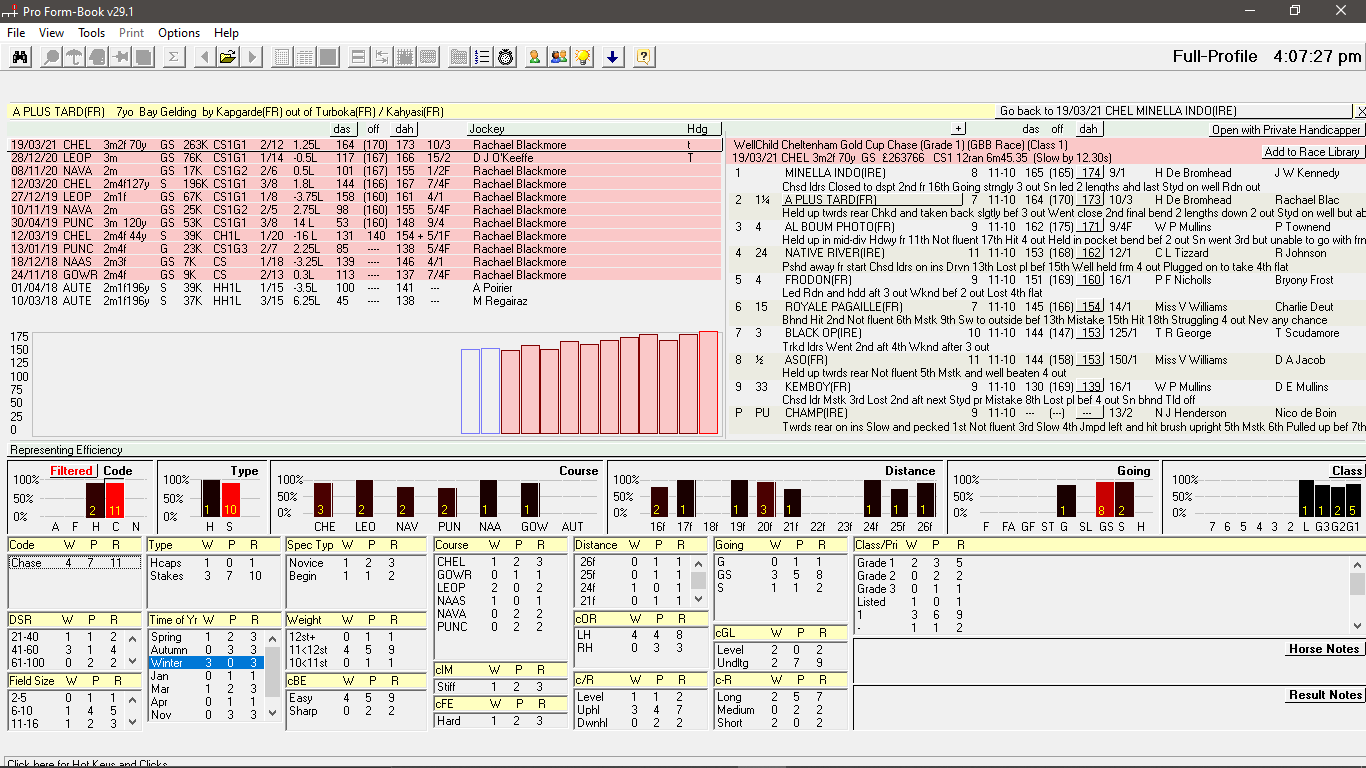
The title bar of the Full-Profile window shows the horse's name, age, gender, sire, dam and dam's sire. Upto the last 200 outings for the selected horse are listed on the left side of the screen. Flat results are shown in green, Hurdles/NHF in blue, Chases in brown, and All-Weather in orange. The currently selected result is displayed close-up on the right.
Ratings
Ratings in the Full Profile window are always unadjusted. The buttons above ratings show which ratings are being displayed. Click to change. das=DataForm Speed. prs=Private Speed. dah=DataForm Handicap. prh=Private Handicap.
Editing Ratings
Right-click on the winner's dah/prh rating to select a rating for it. Ratings will be calculated for all other runners using the appropriate 'Pounds Per Length' value for the Code and Distance of the race. To edit the 'Pounds Per Length' values select PrH Options from the Options menu. To ignore weight-carried in calculations put a tick next to the Ignore Weight-Carried option at the bottom of the Pounds Per Length table.
Left-click on the dah/prh button at the top of the result to increment/decrement all runners' ratings. Click on individual ratings to increment/decrement them individually. To zero all ratings in the result right-click on the winner's rating and select 0.
Wins, Placeds, Runs data
WPR data is based on however many outings have currently been loaded/viewed. Click the down arrow below the form-lines to load more form. Select OPTIONS then WPR OPTIONS to change the way WPR data is displayed.
Ratings Graph
Performances (handicap ratings achieved) are graphically represented below form-lines. Click the dah/prh button above form-lines to view DataForm or Private handicap ratings.
Preference Graphs
EFFICIENCY/BEST DAH, separated by Race Code, Type, Distance, Going, Class and Prize, are graphically represented below the Ratings graph. The number of runs in each category is shown in yellow at the base of each bar. The colour of each bar represents the number of times the horse has run in the category. The brighter red the bar the more runs the horse had in the category. NOTE: When BEST DAH is selected, graphs will always be filtered by a Code. This is to prevent the mixing of performances rated under different scales.
Controls
Left-click on bars in the Efficiency/Best Performances graphs to filter all other graphs (and Wins/Place/Runs data) by that criteria only.
Left-click the long button above the Efficiency/Best Performance graphs to toggle between Efficiency or Best Performance (best handicap rating achieved).
Use the PAGEUP and PAGEDN keys or click the + and - buttons to page through each result.
View any listed result close-up by clicking on it or use the LEFT and RIGHT cursor direction keys to navigate forwards or backwards through results.
View the Full Profile of any other displayed horse by clicking onto its name or by selecting it with the UP and DOWN cursor direction keys and pressing ENTER (click the GO BACK TO.. button to return to the previous result and profile).
Left-click the OPEN WITH PRIVATE HANDICAPPER button to view the result in Private Handicapper.
Left-click the ADD TO RACE-LIBRARY button to add the result to the Race-Library, so that it can be analysed and studied (exactly as it would have been on the day). NOTE: Scheduled Race-Times, Racecard Numbers, Headgear, Owners and Colours are not stored on the results database so they will not appear in the race when it is opened from the Race-Library. Racecard Numbers will be replaced with finishing positions. FSPs (forecast prices) will be replaced with RSPs (returned prices). National Trainer and Jockey statistics (TrA and JoA) displayed after analysis will be those which were available at the time the race took place.
 MINI-PROFILES
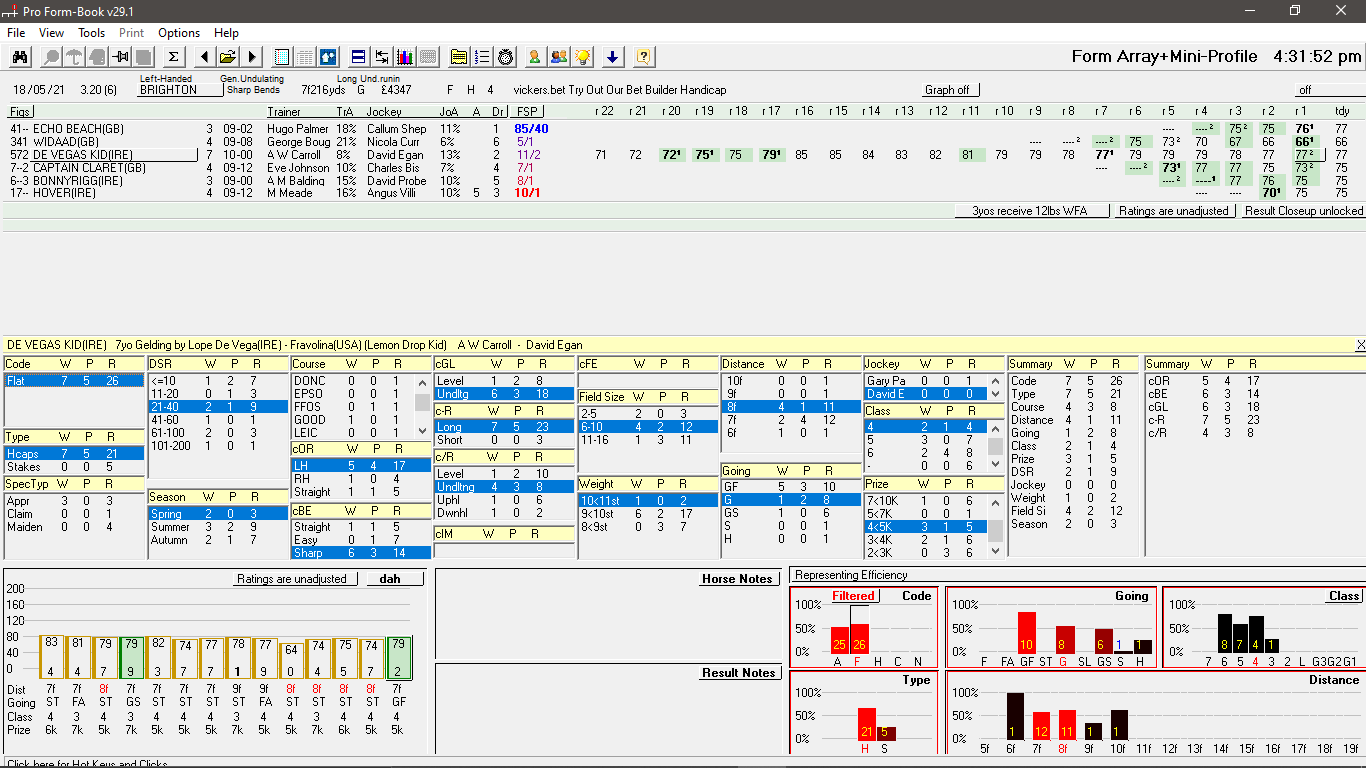
Select VIEW then MINI-PROFILE (or click the MINI-PROFILE Toolbar button) to view the Min-Profile window (available when a race is open only).
All WPR data is based upon the number of runs/months of form to load as set in Analysis Options (which pops up each time you click ANALYSE). Select OPTIONS then WPR OPTIONS to change the way WPR data is displayed.
Controls
Left-click on bars in the Efficiency/Best Performances graphs to filter all other graphs (and Wins/Placeds/Runs data) by that criteria only.
| Privacy and Data Protection | Contact us | Gamble Responsibly BeGambleAware |
 |
| © 1987-2026 DataForm |